The traditional load forecasting framework assumes that load is uncertain and generation is controllable. Behind-the-meter solar breaks this assumption on both sides: it reduces metered load without appearing in SCADA telemetry, and it introduces a generation uncertainty correlated with weather that the balancing authority cannot observe directly.
Why "Net Load" Is Not "Load Minus Solar"
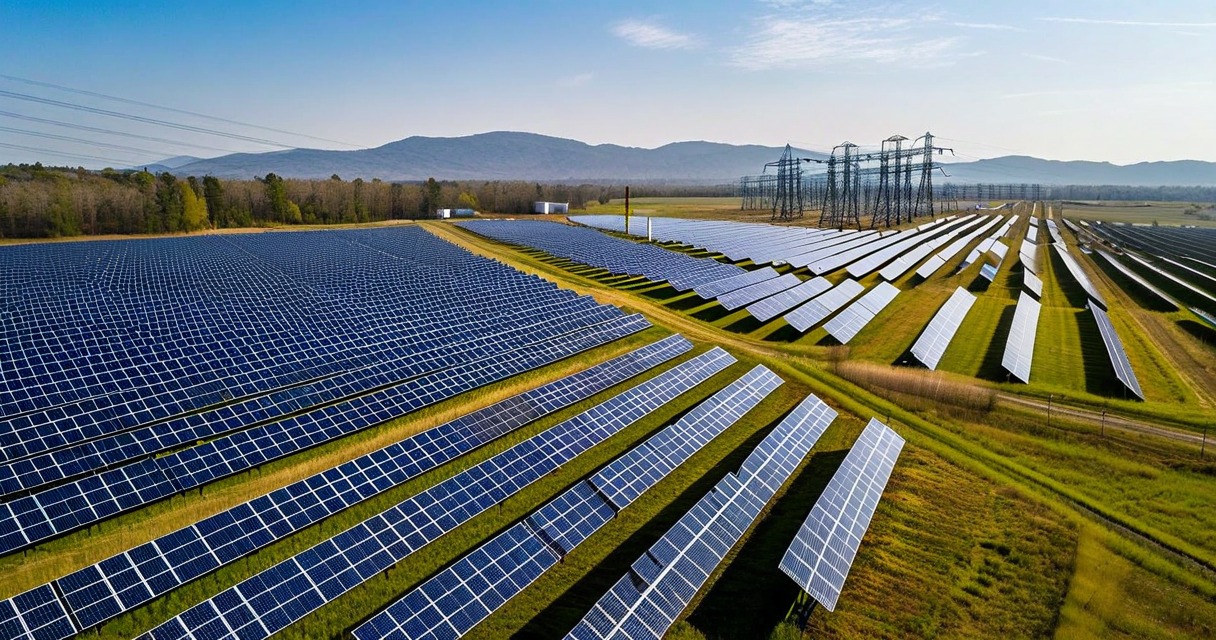
Net load — the electricity demand that must be served by the bulk power system — equals gross load minus behind-the-meter (BTM) generation. In a utility service territory where 30% of peak capacity is BTM solar, the relationship between gross load and net load varies by several hundred MW depending on time of day, cloud cover, and season.
The conceptual error many utilities make when they first encounter significant BTM solar penetration is treating net load forecasting as a two-step process: forecast gross load, then subtract a solar generation estimate. This framing underestimates the interaction between the two variables. BTM solar affects gross load directly — air conditioner usage drops when solar output is high because distributed generation reduces net electricity costs for participating customers — creating a feedback that makes gross load itself a function of solar irradiance.
The more accurate framing is that net load is the primary forecast variable, and the model should be trained on historical net load (what the metered SCADA data actually reports) rather than reconstructed gross load. The complication is that historical metered load already incorporates BTM solar, so any year-over-year comparison must account for the changing BTM solar capacity — which grows as new residential and commercial installations come online throughout the year.
The Duck Curve and Its Operational Consequences
CAISO's original duck curve analysis in 2013 identified the operational challenge that high BTM solar penetration creates: midday net load drops substantially below morning levels as solar output peaks, then rises sharply in the late afternoon as solar generation declines and air conditioning load increases. The evening ramp — typically 2,000–5,000 MW in CAISO over 3 hours — requires rapid response from dispatchable generation that must be held in reserve during midday low-load conditions.
For utilities outside CAISO, the duck curve becomes operationally relevant at roughly 15–20% BTM solar penetration of peak capacity. Below that threshold, the midday depression is manageable with normal operating reserve. Above it, the afternoon ramp rate begins to exceed what thermal generation can provide without specific operational preparation — which means the magnitude and timing of that ramp must be forecast with higher accuracy than traditional day-ahead models were designed to provide.
The two forecasting errors that produce the highest balancing costs in high-BTM-solar environments are: (1) cloud cover transitions that arrive earlier than forecast, causing net load to spike earlier in the afternoon than scheduled generation can accommodate, and (2) morning fog clearing faster than expected, causing midday net load to drop below anticipated levels and forcing dispatchable generation to curtail unexpectedly.
What Changes in the Model Architecture
Forecasting net load in a territory with high BTM solar requires several architectural differences from a traditional load-only model:
Solar irradiance as a primary feature: Weather-based forecasting models typically use temperature, humidity, and day-of-week as primary features. For net load, global horizontal irradiance (GHI) and diffuse horizontal irradiance (DHI) — the components of solar radiation relevant to flat-panel installations — must be included as features, typically sourced from NWP (Numerical Weather Prediction) models at 1–4 km spatial resolution.
BTM capacity as a time-varying input: As new BTM solar installations come online, the relationship between irradiance and net load changes. Models trained on historical data without accounting for installed capacity growth will systematically over-forecast net load during high-irradiance periods as BTM penetration increases. This requires tracking the cumulative BTM capacity in the service territory from interconnection records and updating model features accordingly.
Cloud ramp features: The most consequential forecast errors are not about average irradiance levels but about rapid transitions — a cloud bank moving through a service territory over 20–30 minutes. Including cloud movement features derived from satellite imagery (updated every 5–10 minutes from GOES-16/17) or numerical cloud advection models materially improves 15-minute-ahead forecast accuracy during partly cloudy conditions, which are the highest-error conditions for standard weather-based models.
The Data Availability Problem
Building a high-quality BTM solar forecast requires three data sources that utilities don't always have clean access to: (1) an accurate and current record of BTM solar installations in the service territory, (2) spatially resolved weather forecast data with sufficient resolution to distinguish cloud cover variations across a service territory, and (3) historical performance data from a sample of BTM solar installations to calibrate the irradiance-to-generation conversion model.
BTM installation records are often fragmented across interconnection databases, permit databases, and NEM (Net Energy Metering) program records. Reconciling these sources is a data integration project that typically takes 4–8 weeks for a mid-sized utility. Without it, BTM solar capacity estimates can be off by 15–30%, which translates directly into forecast error during peak irradiance hours.
Spatially resolved weather data at the resolution needed for cloud transition forecasting (1–4 km grid) is available from NOAA's HRRR (High Resolution Rapid Refresh) model, updated hourly with 15-minute forecasts. Most utility weather contracts are for point forecasts or low-resolution regional forecasts that don't capture the spatial variability needed for accurate cloud ramp prediction in distributed solar environments.
Demand Response in a Net-Load World
Demand-response programs designed around traditional peak load management need reconfiguration when BTM solar penetration reaches significant levels. The traditional model dispatches curtailment during high-temperature afternoon peaks — exactly the times when BTM solar generation is declining and net load is rising. This timing alignment remains valid.
What changes is the dispatch trigger logic. A net-load-aware DR trigger should respond not just to absolute MW thresholds but to the rate of net load increase (ramp rate) and the confidence interval around the evening ramp forecast. A dispatch trigger that fires at 85% of peak net load MW may fire too late when solar generation is dropping rapidly and the ramp is steeper than forecast — by the time the threshold is crossed, DR assets need another 15–20 minutes to respond, and the shortfall has already grown.
Ramp-rate-aware dispatch triggers — initiating curtailment when the 15-minute-ahead forecast shows net load increasing at more than X MW/minute — provide earlier warning at the cost of occasional spurious dispatch events when forecast ramp rates exceed actual ramp rates. The tradeoff is managed through confidence-interval thresholds: dispatch at high confidence of ramp exceedance, not at point-forecast exceedance. As we discuss in our article on OpenADR 2.0b dispatch sequencing, spurious dispatch events have real costs beyond balancing — they erode participant program satisfaction and increase long-term opt-out rates.
The Utility Forecast Team's Evolving Role
Traditional load forecasting was primarily a meteorological challenge: model the relationship between temperature, humidity, and load. Net load forecasting in a high-BTM-solar environment adds a second domain — solar energy forecasting — that requires different domain expertise and different data sources.
Utilities that have managed this transition successfully have either added dedicated solar forecasting expertise to their resource planning teams or adopted integrated platforms where the solar and load components are modeled together rather than separately. The key operational requirement is that the net-load forecast uncertainty interval explicitly incorporates both load uncertainty and solar generation uncertainty — a composite that is typically 20–40% larger than either component alone during partly cloudy conditions.